O2 Nose Filters are a nasal dilator paired with advanced 3M filtration technology. The innovative electrostatically charged filters capture 90% of harmful airborne particles at PM10 and 65% at PM2.5.
Introduction
Non-electrostatically charged filters (mechanical filters) rely on physical phenomena like inertia, velocity, and collision to capture airborne particles. Particles in the air have to “run into” filter fibers on a one-dimensional surface to become successfully tethered to the filter fibers. When tested against electrostatically charged filters, known as “electret media”, these factors can lead to a decrease in mechanical filters’ performance.1 Electrostatic filtration technology is analogous to how a magnet attracts iron particles. Somewhat surprisingly, due to principles of electrostatics, electret filter performance is enhanced as its mechanical properties are enhanced, when particles adhere to charged filter fibers, enlarging the fibers’ surface area. This enlarged “charged” surface area continues to attract particulates as they encounter the filter media.2 Airborne particles that transport viruses and bacteria, referred to by academia as “droplet nuclei”, are typically composed of the pathogen itself enveloped in sneeze or cough droplets.3,7 Average sizes for human-produced droplet nuclei are between 0.5 to 12 microns in diameter.4,5 Protego O2’s use of 3M’s patented AEMTM (Advanced Electret Media) provides users of its nasal filtration products up to 90% protection from airborne contaminants at PM10 and 65% at PM2.5, including allergens, bacteria and other pathogens, and air pollution. 6
Measuring Filtration Efficiency
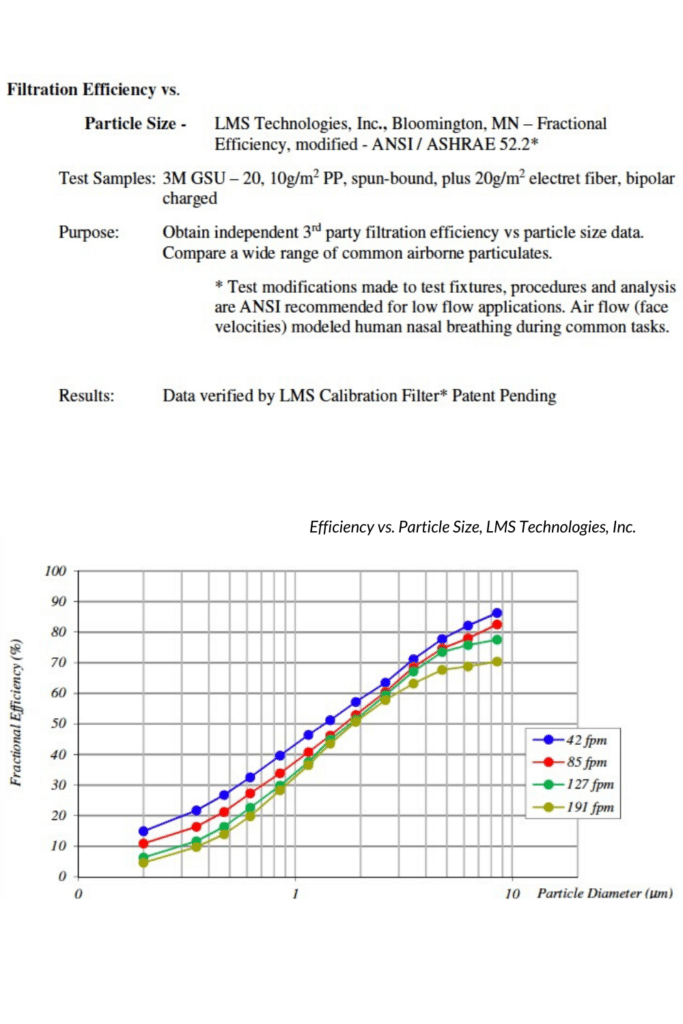
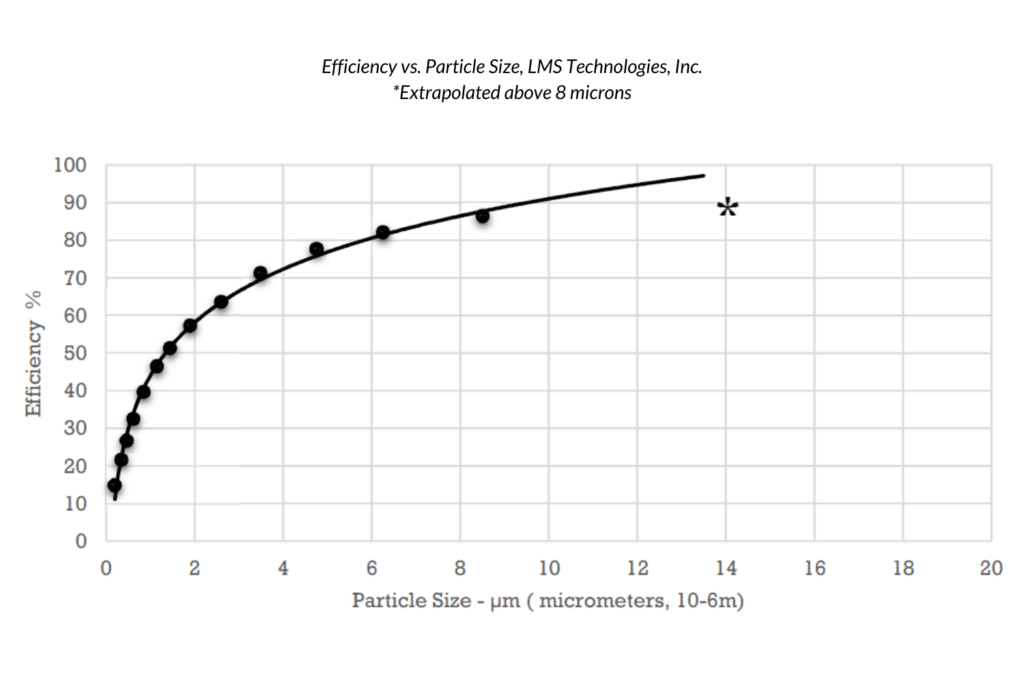
Filter performance, or efficiency, is expressed in percentage terms and enumerates the relationship between particle size, particle concentration, and velocity. 3M filtration materials are FDA accepted and Protego O2 products’ filter performance is verified by LMS Technologies, Inc. (see attached graphs) The ability of charged filter fibers to attract and hold sub-micron particulates offsets the necessity for dense filter construction, allowing good airflow without compromising particle capture. Hence, AEMTM filters are an appropriate use for personal nasal filter devices.
Capture Ratios
3M’s patented AEMTM (Advanced Electret Media) filter technology relies on the principles of electrostatic attraction1, or the creating of electrical charges on filaments, to produce ionically charged filter fibers constructed in a 3- dimensional format. The high capture ratios and extended breathability attributed to 3M’s AEMTM filtration materials are due to the fibers’ high charge, uneven charge distribution, and less dense media construction, allowing airborne particles to be captured within the filter throughout several layers of media. Because the charged filter fibers act as “magnets” and not merely “walls” to attract and secure airborne particulates, the less dense format of fiber filters does not adversely impact the filter’s ability to retain particulates – especially in the <5-micron size range. This design is the first and only personal nasal insert available with 3M AEMTM filtration technology.
Applications
Common applications of 3M’s patented Advanced Electret Media filter technology include pulmonary units within healthcare institutions, HVAC systems, and air cabin filtration.
Practical / Intended Use
Filtration efficiency experienced by each individual user is dependent on a large number of uncontrollable variables associated with environmental conditions and human activity. The O2 nasal dilator with a 3M filter insert is not intended to replace any personal full-face breathing filtration device required or specified for hazardous environmental conditions. In determining expected efficiency, the following should be considered.
Particulates in the Air
Man-made and natural contaminates in the air we breathe range from subatomic particles to particles easily visible to the naked eye. The distribution of particles by size and type can be highly variable, even from one cubic meter of air to the next.
The Condensation Effect
All airborne particles can be expected to, dependent on condition, take on some water vapor. This condensation effect, more prevalent at high humidity, can continue until contaminates trapped in the water, now a fog, mist or larger droplets, fall to the earth. The very smallest particulates, when trapped in water, take on H2O increasing their perceived size by minimally 80% and as much as 1000% or even more dependent on conditions; as an example, a 2.5 μm size particle dry will be filtered wet at approximately 4.5 μm minimum in size or larger. The amount of water that condenses on any one or group of particles is dependent on size and is as variable as the weather conditions. This process significantly increases the effectiveness of the 3M filtration material by enlarging the size of particles that otherwise would pass through more easily.
The condensation effect increases the effectiveness of the 3M filtration material with viruses and other airborne pathogens. Airborne viruses and bacteria (2 μm and larger wet) need moisture to live; airborne infection is dependent on moisture. Viruses and bacteria are released into the air in water droplets, normally in groups larger than a single virus (droplet sizes as described above) and either quickly fall to the ground, take on more water, or begin to dry, dependent on conditions.
The process of comparing the laboratory data presented here to real world application highlights a large set of interacting variables. There are several measurement techniques that have been implemented in measuring contaminates in the air; the number of particles of specific sizes in a cubic meter of air. To say that statistically there are a number of particles that are 2.5 μm or smaller in the volume, and a number of particles at 10 μm or smaller (which obviously include the 2.5 μm particles), etc. does not tell the whole story when we consider all the particles and their constant changing position in and out of a specific chosen volume or as they are trapped or measured in air quality testing equipment. Along with the constantly changing particle distribution, humans are constantly moving in and out of these varying distributions. The best we can do is capture the condition at a moment in time, a snapshot.
Measuring techniques employed to help us understand air pollutants have measured the particles in number, mass, size and volume; all are valid yet not easily interchangeable. If volume of particulates is used to measure the amount of pollution of all particle sizes in a volume of air, (1 m3 ) one would expect, during that snap-shot in time, that the filter material tested here, with the face velocities modeling human breathing, 98% or more of the particulates by volume would be filtered.
| Particle Comparisons (examples) | |||
| Expected filtration efficiency vs Application | |||
| Condition / Application | Particle Common Name | Particle Size (microns) | Filtration Efficiency (%) |
| Allergens | |||
| Pollens | 10 – 1000 | 90 100 | |
| Pet Dander | 1 – 9 | 45 – 90 | |
| Spores (general) | 3 – 40 | 65 – 100 | |
| Mold Spores | 10 – 30 | 90 – 100 | |
| Other Pollutants | |||
| Saw Dust | 30 – 600 | 99 – 100 | |
| Dust Mites | 100 – 300 | 100 | |
Particle Definitions
Hazardous Dust Particles
Smaller dust particles can be hazardous for humans. In many jurisdictions dust fractions at specified particle sizes in working environments are required to be measured.
Inhalable Dust
Airborne particles which can enter the nose and mouth during normal breathing. Particles of 100 microns diameter or less.
Thoracic Dust
Particles that will pass through the nose and throat, reaching the lungs. Particles of 10 microns diameter and less. Referred to as PM10 in the USA.
Respirable Dust
Particles that will penetrate into the gas exchange region of the lungs. A hazardous particulate size less than 5 microns. Particle sizes of 2.5 micron (PM2.5) are often used in USA.
The total allowable particle concentration building materials, combustion products, mineral fibers and synthetic fibers (particles less than 10 μm) specified by EPA (U.S. Environmental Protection Agency)
- 50 μg/m3 (0.000022 grain/ft3) allowable exposure per day over the course of 1 year
- 150 μg/m3 (0.000022 grain/ft3) allowable exposure over 24 hours
Pollens
(5 μm and larger dry, 9 μm and larger wet), are a very common nasal irritant and cause many secondary health problems.
Particle Sizes
The size of contaminants and particles are usually described in microns, a metric unit of measure where one micron is one-millionth of a meter. There are 25400 microns in one inch. The eye can see particles to about 40 microns. The size of some contaminants and particles are indicated in the table below. When airborne, The Condensation Effect significantly increases the typical size of most particles. The sizes in the following chart are the “Dry” Particle size. The very smallest particulates, when trapped in water, take on H2O increasing their perceived size by minimally 80% and as much as 1000% or even more dependent on conditions; as an example, a 2.5 μm size particle dry will be filtered wet at approximately 4.5 μm minimum in size or larger.
| Particle | Dry Particle Size (microns) |
| one inch | 25400 |
| dot (.) | 615 |
| Eye of a Needle | 1230 |
| Glass Wool | 1000 |
| Spanish Moss Pollen | 150 750 |
| Beach Sand | 100 10000 |
| Mist | 70 350 |
| Fertilizer | 10 1000 |
| Pollens | 10 1000 |
| Cayenne Pepper | 15 1000 |
| Textile Fibers | 10 1000 |
| Fiberglass Insulation | 1 1000 |
| Grain Dusts | 5 1000 |
| Human Hair | 40 300 |
| Dust Mites | 100 300 |
| Saw Dust | 30 600 |
| Ground Limestone | 10 1000 |
| Tea Dust | 8 300 |
| Coffee | 5 400 |
| Bone Dust | 3 300 |
| Cement Dust | 3 100 |
| Ginger | 25 40 |
| Mold Spores | 10 30 |
| Starches | 3 100 |
| Red Blood Cells | 5 10 |
| Mold | 3 12 |
| Mustard | 6 10 |
| Antiperspirant | 6 10 |
| Textile Dust | 6 20 |
| Gelatin | 5 90 |
| Spider web | 2 3 |
| Spores | 3 40 |
| Combustion-related motor vehicles, wood burning, open burning, industrial processes | up to 2.5 |
| Fly Ash | 1 1000 |
| Milled Flour, Milled Corn | 1 100 |
| Coal Dust | 1 100 |
| Iron Dust | 4 20 |
| Smoke from Synthetic Materials | 1 50 |
| Lead Dust | 2 |
| Face Powder | 0.1 30 |
| Talcum Dust | 0.5 50 |
| Asbestos | 0.7 90 |
| Calcium Zinc Dust | 0.7 20 |
| Paint Pigments | 0.1 5 |
| Auto and Car Emission | 1 150 |
| Metallurgical Dust | 0.1 1000 |
| Metallurgical Fumes | 0.1 1000 |
| Clay | 0.1 50 |
| Humidifier | 0.9 3 |
| Copier Toner | 0.5 15 |
| Liquid Droplets | 0.5 5 |
| Insecticide Dusts | 0.5 10 |
| Anthrax | 1 5 |
| Yeast Cells | 1 50 |
| Carbon Black Dust | 0.2 10 |
| Atmospheric Dust | 0.001 40 |
| Bacteria | 0.3 60 |
| Radioactive Fallout | 0.1 10 |
| Burning Wood | 0.2 3 |
| Oil Smoke | 0.03 1 |
| Tobacco Smoke | 0.01 4 |
Materials Safety Testing
Allergic Reaction / Toxicity Testing – Pacific BioLabs
Cytotoxicity Elution Test (MeM Extract)
ANSI / AAMI / ISO 10993-5: 2009
Purpose: O2 Nose Filters are made with medical grade polymer. This material was tested by Pacific BioLabs to evaluate the cytotoxic potential of extracts of polymeric materials or any other materials intended to be implanted in the human body or that may come into contact with body fluids or injectable solutions. This test was performed according to PBL SOP 15B-01 which follows procedures outlined in ISO 10993-5.
Conclusion: The test articles were not considered to have a cytotoxic effect (no reactivity) according to the qualitative evaluation of cells exposed to extracts based on the grading criteria in ANSI / AAMI / ISO 10993:2009.
References
1) Annual Conference of Nonwovens in Filtration. 2003. Mechano-electret Filtration Media: Synergy of Structure and Electrostatic Charge.
2) ASHRAE Report: Investigation of Mechanism and Operating Environments that Impact the Filtration Efficiency of Charged Air Filtration Media, 1189-TRP.
3) 3M Technical Data Bulletin, Number 174. Respiratory Protection for Airborne Exposures to Biohazards. October 2009.
4) Duguid, J.P. 1946. The size and duration of air-carriage respiratory droplet nuclei. Journal of Hygiene 44: 471-479.
5) Yang, Shinhao, Lee, Grace, W.M., Chen, Cheng-Min, Wu, Chih-Cheng, Yu, Kuo-Pin. 2007. The size and concentration of droplets generated by coughing in human subjects. Journal of Aerosol Medicine 20: 484-494.
6) Villareal, Luis, P. Are Viruses Alive? Scientific American. December 2004.
7) Product Brief. 3M Energy and Advanced Materials Division. 3M Air Filter Media Type G. May 2008.